Seasons and Dust Storms on Mars
Mars tilts 25.19 degrees like Earth but its orbit is far more elliptical. How that makes unequal seasons, a freezing atmosphere and global dust storms.
TL;DR· 18 min read
Mars is tilted 25.19 degrees, close to Earth's 23.44, so it has four proper seasons, but its orbit is five and a half times more eccentric, which makes them badly unequal: northern spring runs 193.3 sols against northern autumn's 142.7. Each winter about a quarter of the atmosphere freezes onto a polar cap and then returns. Regional dust storms come every year and roughly one year in three or four turns planet-encircling; eight are confirmed since 1956, the last in 2018, and nobody can say in advance which year it will be.
Mars has dust storms because it has a dry planet's worth of loose dust, winds strong enough to lift it, and a season each year when the sunlight is 45 per cent brighter than at the other end of the orbit and the atmosphere heats up hard. Its seasons run in the same order as Earth's, for the same reason, but they are about twice as long and markedly unequal in length: the tilt gives Mars seasons, and the stretched orbit makes the southern summer short and fierce and the northern summer long and mild. The strangest part is not the dust. It is that every winter about a quarter of the entire atmosphere freezes solid onto a polar cap and then comes back.
- 25.19°axial tilt, against Earth's 23.44°, which is why Mars has seasons at all
- ~1/4of the whole atmosphere freezes onto a winter pole each year; published estimates run from a sixth to a third
- 8planet-encircling dust storms confirmed since 1956, and none confirmed since 2018
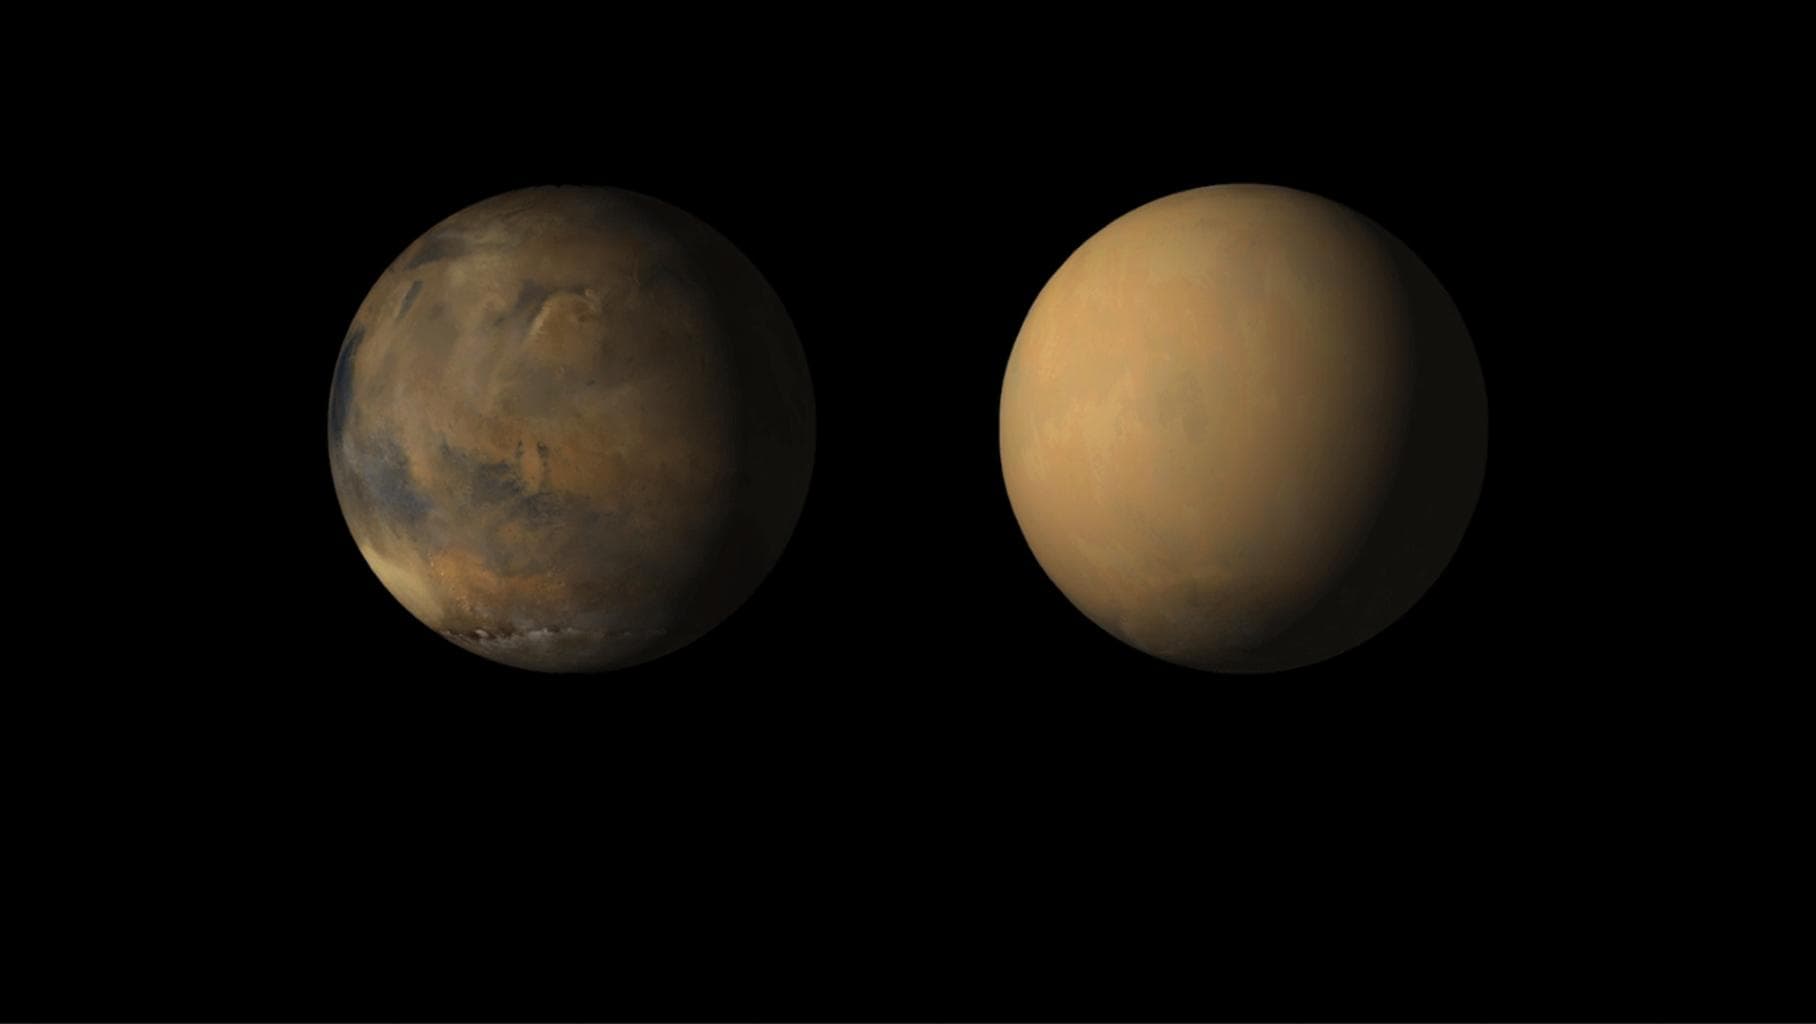
Two numbers set up everything else. The first is the axial tilt, 25.19 degrees, which is within two degrees of Earth's 23.44. That is the whole reason Mars has seasons, and it means they work the way ours do: each hemisphere leans sunward for half the year and away for the other half, with equinoxes and solstices in between. The second number is the orbital eccentricity, 0.0935, which is five and a half times Earth's 0.0167. Mars swings from 206.65 million kilometres from the Sun at perihelion to 249.261 million at aphelion, and by the inverse square law that is about 45 per cent more sunlight at the near end than the far end. Earth's equivalent variation is about 7 per cent, small enough that most people never notice it. On Mars it dominates. A planet moves fastest when it is closest to the Sun, so the seasons that contain perihelion are compressed and the ones that contain aphelion are stretched. The result, measured in sols, is northern spring 193.3, northern summer 178.6, northern autumn 142.7 and northern winter 154.0, adding to a year of 668.6 sols or 687 Earth days. Read that from the southern hemisphere and it says southern summer is 154 sols long and takes place close to perihelion, while northern summer is 178.6 sols long and happens near aphelion. Southern summer is short, bright and violent. Northern summer is long and mild. Almost everything interesting about Martian weather follows from that asymmetry.
Now the fact that ought to be more famous than it is. Through the long polar winter the pole sits in darkness and radiates heat to space with no sunlight to replace it, and the air above it cools until carbon dioxide stops being a gas. Because the atmosphere is 95 per cent CO2, that does not produce a minor frost. It removes a large fraction of the entire atmosphere from circulation and stacks it on the ground as ice. Leighton and Murray predicted this in 1966, before anyone had measured Martian surface pressure, and the Viking landers confirmed it in the 1970s: daily mean pressure at the Viking 1 site ran between about 6.9 and 9 mbar over one year, and Perseverance watched the same curve at Jezero, mean daily pressure sliding from 761 to 625 pascals. How much of the atmosphere is involved is a genuinely contested number, and the published figures are not measuring the same thing. Schmidt and colleagues put the condensation and sublimation cycle at about one quarter of atmospheric mass. Smith, Zuber and Neumann, reading the caps' thickness with a laser altimeter, say as much as a third over the year. Genova and colleagues, weighing the caps through their pull on orbiting spacecraft, found up to four trillion tonnes on the northern cap alone, about a sixth of the total. A quarter is the usual shorthand. A sixth to a third is the honest range.
Dust gets into the air because something lifts it, and that turns out to be harder to pin down than it sounds. Individual dust grains, finer than 62 micrometres, stick to each other and to the ground, and the thin air struggles to peel them off directly. The efficient route is saltation: wind gets sand grains around 100 micrometres bouncing along the surface, and each impact knocks fine dust into suspension. Older wind tunnel work and models put the threshold at wind speeds of roughly 15 to 22 m/s at 1.5 metres above the ground, which landed missions almost never recorded, yet orbiters kept seeing fresh dune movement and dust devil tracks. That contradiction has a name in the literature, the Martian sand transport puzzle, and it is not fully resolved. A more recent wind tunnel experiment put the threshold far lower still. In-situ peaks are higher than once thought: about 31 m/s at InSight, about 32 m/s at Perseverance. And in October 2025 Bickel and colleagues tracked 1,039 dust devils from orbit and found their drift, and so the ambient wind carrying them, running up to about 44 m/s and routinely exceeding both the saltation threshold and what circulation models predict. Meanwhile the annual pattern is orderly. In years without a global event, three regional storm sequences recur in the same seasonal order, labelled A, B and C, starting near Ls 225, 250 and 310. Dust storms on Mars are not rare weather. They are the climate.
Planet-encircling storms are the rare ones, and 'planet-encircling' is the careful term because the dust encircles the planet rather than obliterating it. Eight are confirmed in the last seventy years, in 1956, 1971, 1973, 1977 twice, 2001, 2007 and 2018, all beginning between Ls 185 and Ls 300, in the perihelion half of the year. Even that count is a matter of which catalogue you use: Richard McKim's telescopic survey for the British Astronomical Association lists ten events since 1873, adding 1909, 1924, 1975 and 1982, and Shirley and colleagues work from a catalogue that includes an 1877 event. The 2018 storm is the best documented. It began on 30 May in Acidalia Planitia as a patch of about 140,000 square kilometres, the first confirmed global storm to start in the northern hemisphere, spread south down the Acidalia corridor at around 5 m/s, crossed the equator, and by 8 June was running east along the southern cap edge at 40 m/s. At Gale crater, Curiosity watched optical depth climb from about 0.6 to 8.5 in twelve sols, ultraviolet sunlight at the ground drop by 97 per cent and the daily temperature swing collapse by 30 K, then decay away over a 43-sol time constant. Streeter and colleagues later found the storm warmed the planet's surface on average, by 0.9 K, because the nightside warming from dust radiating downward outweighed the daytime shading.
The word 'storm' is doing damage here. At six millibars the air has almost no mass to throw at anything. Surface density is about 0.020 kg per cubic metre against 1.217 at Earth's sea level, so Martian air is roughly one sixtieth as dense, and the force a wind exerts scales with density times speed squared. Take the fastest wind ever measured at a Mars landing site, about 32 m/s at Perseverance, which sounds like 72 miles per hour. Run the arithmetic and it pushes about as hard as a 4 m/s breeze on Earth, roughly 9 miles per hour. NASA has said the same thing plainly: even the wind in the largest dust storms likely could not tip or rip apart major mechanical equipment. The opening of The Martian, in which a gale nearly blows a crew off the planet, is good drama and bad physics. What dust storms actually do is block light and stick to things. Opportunity died because opacity over Perseverance Valley hit an estimated 10.8, against a normal 0.5, and its solar arrays could not charge; Spirit and Opportunity both nearly went the same way in 2007. InSight was killed by something slower still, dust accumulating on its panels; NASA's InSight team put the obscuration at about 80 per cent, a figure from mission press material rather than a paper. Curiosity and Perseverance, which run on plutonium rather than sunlight, worked straight through 2018.
What nobody can do is tell you which year the storm will be global. Every Martian year produces regional storms; roughly one year in three or four produces a planet-encircling one, and the trigger is unknown. The standard explanation, a runaway feedback in which dust absorbs sunlight, heats the air, strengthens the Hadley circulation and lifts more dust, works for storms that start near the southern summer solstice but cannot explain the 2001 and 2018 events, which began near the equinox when that circulation is roughly symmetric about the equator. Thermal tides and long-range teleconnections have been proposed instead. Another family of ideas blames the supply side: perhaps the surface dust reservoirs need several years to recharge. The most publicised proposal is James Shirley's orbit-spin coupling, which holds that a term arising from Mars's orbital angular momentum forces the atmosphere directly. It matched the historical catalogue well enough that Shirley, McKim, Battalio and Kass published conditional forecasts for Mars Years 35 through 40 in 2020, and it was built into a general circulation model by Newman and colleagues in 2019. In February 2026 Thomas Pierron and François Forget published a re-derivation of the inertial forces on a parcel of Martian air and concluded that the coupling term comes from an inconsistent application of the transport theorem and should not be in the momentum equation at all, leaving the variability to atmospheric dynamics, radiative feedbacks and dust supply. That argument was still open when Mars Year 38 ended, on 30 September 2026.
What we know
Axial tilt
25.19 degrees, against Earth's 23.44. This is the number that gives Mars seasons: it means each hemisphere leans toward the Sun for half the year and away for the other half, exactly as on Earth. Nothing about the seasonal cycle on Mars is exotic in kind. What is different is the length and the balance.↗
Orbital eccentricity
0.0935, against Earth's 0.0167, a ratio of 5.6. Mars is 206.65 million km from the Sun at perihelion and 249.261 million km at aphelion. By the inverse square law that is about 45 per cent more sunlight at the near end of the orbit than at the far end. Earth's equivalent swing is about 7 per cent.↗
Length of the year and the day
668.6 sols, or 686.980 Earth days. A sol is 88,775.245 seconds, 24 hours 39 minutes 35 seconds, which is 2.7 per cent longer than an Earth day. That near-coincidence in day length, with a year nearly twice as long, is why Martian seasons feel familiar but last about twice as long.↗
Solar longitude (Ls)
Dates on Mars are given as Ls, the angle between Mars and the Sun measured from the northern spring equinox. Ls 0 is northern spring equinox, Ls 90 northern summer solstice, Ls 180 northern autumn equinox, Ls 270 northern winter solstice. Aphelion falls at Ls 71 and perihelion at Ls 251. Every dust storm paper on this page uses Ls rather than a date, because Ls is the same season on Mars in any year.↗
The seasons are unequal
Northern spring 193.3 sols, northern summer 178.6, northern autumn 142.7, northern winter 154.0. Southern seasons are the same figures swapped. Mars moves fastest near the Sun, so the season containing perihelion is compressed. Southern summer is 154.0 sols and hot; northern summer is 178.6 sols and mild. The difference is nearly 25 sols.↗
Mars years
By convention Mars Year 1 began on 11 April 1955, a numbering chosen so that the 1956 global dust storm fell in year 1. Mars Year 34 began 5 May 2017, MY 35 on 23 March 2019, MY 36 on 7 February 2021, MY 37 on 26 December 2022, MY 38 on 12 November 2024 and MY 39 begins on 30 September 2026. The formal enumeration is Piqueux et al. (2015).↗
Surface pressure and its annual swing
Mean surface pressure is about 6.36 mbar at mean radius, roughly 0.6 per cent of Earth's 1,014 mbar, and it varies from about 4.0 to 8.7 mbar depending on season and elevation. At the Viking 1 site the annual range was 6.9 to 9 mbar. Perseverance measured mean daily pressure at Jezero falling from 761 Pa to 625 Pa across part of one year. The pressure changes because the mass of the atmosphere changes.↗
How much of the atmosphere freezes out
Contested, and the published figures measure different things. Schmidt et al. (2010) state the polar condensation and sublimation cycle involves about one fourth of the atmospheric mass. Smith, Zuber and Neumann (2001), reading seasonal cap thickness with the MOLA laser altimeter, say as much as a third freezes out over the year. Genova et al. (2016), weighing the caps by their effect on Mars's gravity field, found up to about 4 trillion tonnes on the north cap in northern winter, which against a total atmospheric mass of about 2.5 x 10^16 kg (25 trillion tonnes) is roughly a sixth, for that one cap. A quarter is the usual shorthand. A sixth to a third is the honest range, depending on which pole, which year and which method.↗
Why the storm count is disputed
Different catalogues count differently because they include different eras and different standards of confirmation. Jeffrey Beish, writing for the Association of Lunar and Planetary Observers, records that Richard McKim, Director of the Mars Section of the British Astronomical Association, concluded from an exhaustive historical study that there have been only ten planet-encircling events reported since 1873: 1909, 1924, 1956, 1971, 1973, 1975, 1977 (two storms), 1982 and 2001. That list predates 2007 and 2018 and includes four events the spacecraft-era catalogues do not confirm. Shirley et al. (2020) work from a further expanded catalogue that adds telescopically observed equinoctial storms in 1877 and 1909.↗
What the polar caps are made of
The seasonal caps that grow and shrink each year are frozen carbon dioxide, reaching down to about 50 degrees latitude at maximum. The permanent residual cap in the north is water ice; the southern residual cap is water ice with a veneer of carbon dioxide metres to tens of metres thick. While that CO2 veneer lasts it sits in solid-vapour equilibrium with the atmosphere and holds the global mean pressure near its saturation value. Whether it is a stable long-term buffer or a remnant now eroding, and how much CO2 is buried below it, are open questions.↗
Snow or frost
Open question. General circulation models predicted that 25 to 40 per cent of the seasonal cap mass arrives as CO2 snowfall rather than frost condensing directly on the ground. Hayne, Paige and Heavens (2014), using Mars Climate Sounder observations of south polar CO2 clouds, constrain snowfall to between 3 and 20 per cent by mass at 70 to 90 degrees south. Which mechanism dominates is still unsettled, largely because the clouds form in polar night where there is no sunlight to see by.↗
Storm size classes
Cantor et al. (2001) classify a dust storm by the area it covers: local below 1.6 million square kilometres, regional above it. Cantor (2007) proposed 10 million square kilometres as the ceiling for calling a storm regional. Beyond that the term is planet-encircling, or global dust storm, or planet-encircling dust event. The words are used interchangeably in the literature and none of them means the whole surface is invisible.↗
The storms that happen every year
In years without a global event, three large regional storm sequences recur in the southern hemisphere in the same seasonal order, labelled A, B and C by Kass et al. (2016). They start at about Ls 225, Ls 250 and Ls 310. The C storms vary most from year to year. Regional dust storms are not the exception on Mars; they are the climate.↗
Confirmed planet-encircling storms
Eight in the past seventy years: 1956, 1971, 1973, 1977A, 1977B, 2001, 2007 and 2018. Every confirmed onset falls between Ls 185 and Ls 300, inside the perihelion half of the year. The 2018 event is the only one confirmed to have begun in the northern hemisphere; for the others the onset was in the south between 30 and 60 degrees latitude. During one of these the whole surface is dust-covered for two to three months.↗
What the 2018 storm did
Curiosity measured 880 nm optical depth rising from about 0.6 to a peak of 8.5 in twelve sols, a 97 per cent reduction in ultraviolet sunlight reaching the ground, a 30 K collapse in the daily air temperature range, and the semidiurnal pressure tide climbing to 40 Pa. No active dust-lifting sites were seen inside Gale crater; the dust was all imported. Opacity then decayed with a time constant of 43 plus or minus 2 sols.↗
How hard the wind actually blows
The fastest straight-line wind ever measured at a Mars landing site is about 32 m/s (72 mph) at Perseverance; InSight recorded about 31 m/s, Viking 1 and 2 about 12 and 23 m/s. Those four figures are from Bickel et al. (2025). Surface air density is about 0.020 kg/m3, against 1.217 kg/m3 at Earth's sea level, so Martian air is roughly one sixtieth as dense; both densities are from the NASA fact sheets. Wind force scales with density times speed squared, so a 32 m/s Martian wind pushes on you about as hard as a 4 m/s (9 mph) breeze on Earth. That comparison is arithmetic done for this page; it is not quoted from a published result.↗
What happened, and when
- 8 Jul 1966Robert Leighton and Bruce Murray publish a model of Mars in which the atmosphere is mostly carbon dioxide in equilibrium with polar caps of solid CO2, so that the caps regulate the surface pressure of the whole planet. It is a prediction, made before any spacecraft had measured the pressure, and it turns out to be right.
- 22 Sep 1971A bright cloud spreads out of Noachis and becomes the storm that greets Mariner 9 on 14 November. The first spacecraft ever to orbit another planet arrives to find the surface hidden, with only four volcano summits standing above the dust. It waits until January 1972 to start mapping. Mars 2 and Mars 3 arrive into the same storm, with camera exposures fixed before launch for a planet they cannot see.
- Jul 1973Conway Leovy, Richard Zurek and James Pollack publish Mechanisms for Mars Dust Storms in the Journal of the Atmospheric Sciences, the first serious attempt to say what drives them. Among the ideas it puts forward, and the one still being tested fifty years later, is that winds driven by the sublimating edge of the seasonal polar cap help power the annual dust cycle. The CO2 cycle and the dust cycle are connected here for the first time.
- Mar 1980Seymour Hess and colleagues publish just over a Martian year of daily mean pressure from the two Viking landers. The seasonal curve is unmistakable: pressure at both sites rises and falls by more than 20 per cent as carbon dioxide leaves the air for the winter pole and returns. It is the first direct measurement of an entire planet's atmosphere changing mass.
- Jun to Jul 2001The first planet-encircling storm watched continuously from orbit. Bruce Cantor's analysis of Mars Global Surveyor camera data becomes the reference description of how such an event grows, and supplies the area thresholds still used to classify storms.
- 7 Dec 2001David Smith, Maria Zuber and Gregory Neumann publish MOLA laser altimetry of the seasonal caps: the ground at high latitudes rises and falls by 1.5 to 2 metres each year as CO2 snow accumulates and leaves. Combining the height change with gravity data gives the deposited ice a density of 910 plus or minus 230 kg/m3, far denser than terrestrial snow.
- 17 Aug 2006Hugh Kieffer, Philip Christensen and Timothy Titus explain the south polar 'spiders': sunlight passes through translucent slab CO2 ice, warms the ground beneath, and the gas produced escapes in jets that carry dust up through the ice and carve branching channels underneath. In September 2024 NASA reported that Lauren McKeown and colleagues had reproduced the process in a vacuum chamber at Martian temperature and pressure; that account comes from a JPL release rather than from a paper read for this page.
- 30 May 2018A dusty patch about 140,000 square kilometres across appears in Acidalia Planitia at 35 N, at Ls 184 (the paper gives Ls 184.2 for the first image and Ls 184.9 in its summary). It is the first confirmed global storm to begin in the northern hemisphere, and with 2001 the earliest in the Martian year on record. It expands south along the low Acidalia corridor at about 5 m/s, crosses the equator, reaches 60 S by 8 June and then races east along the polar cap edge at 40 m/s.
- 10 Jun 2018Sol 5,111. Opportunity sends its last data from Perseverance Valley with atmospheric opacity over the rover estimated by NASA at 10.8, against a normal of about 0.5. The rover was not blown over or buried. It ran out of sunlight. NASA declares the mission complete on 13 February 2019.
- 6 May 2020Paul Streeter and colleagues assimilate spacecraft data through the 2018 storm and find something counterintuitive: averaged over the globe and over the day, the surface got warmer, by 0.9 K. The dayside cooled by 14 K on average and up to 39 K in places, while the nightside warmed by 13 K on average and up to 42 K, because airborne dust scatters the surface's own infrared emission back down.
- 8 Oct 2025Valentin Bickel and colleagues use deep learning on twenty years of Mars Express and Trace Gas Orbiter images to track 1,039 dust devils, and derive their drift speeds. Near-surface winds reach about 44 m/s and systematically exceed what global circulation models predict, frequently passing the threshold needed to start sand saltation and lift dust. Where the dust actually comes from has been an open problem for decades; this narrows it.
- 2 Feb 2026Two results land in the same week. Adrián Brines and colleagues report that a single strong, short-lived, unusually placed dust storm over Syrtis Major in Mars Year 37 (August 2023), in northern summer and well outside the dusty season, lofted water vapour to 60 to 80 km and raised hydrogen escape to space by about 2.5 times. And Thomas Pierron and François Forget publish a re-derivation of the inertial forces on Martian air, concluding that the orbit-spin coupling term used to forecast global dust storms should not appear in the equations at all.
In pictures
Tap a photo to enlarge.
Sources
- NASA NSSDCA Mars Fact Sheet (D. R. Williams), archived 3 June 2025
- Laboratoire de Météorologie Dynamique, Martian Seasons and Solar Longitude
- The Planetary Society, The Mars Calendar (E. Lakdawalla)
- R. B. Leighton and B. C. Murray, Behavior of Carbon Dioxide and Other Volatiles on Mars, Science 153, 136-144 (1966)
- S. L. Hess, J. A. Ryan, J. E. Tillman and R. M. Henry, The annual cycle of pressure on Mars measured by Viking Landers 1 and 2, Geophys. Res. Lett. 7, 197-200 (1980)
- D. E. Smith, M. T. Zuber and G. A. Neumann, Seasonal Variations of Snow Depth on Mars, Science 294, 2141-2146 (2001)
- A. Genova, S. Goossens, F. G. Lemoine, E. Mazarico, G. A. Neumann, D. E. Smith and M. T. Zuber, Seasonal and static gravity field of Mars from MGS, Mars Odyssey and MRO radio science, Icarus 272, 228-245 (2016)
- F. Schmidt et al., Sublimation of the Martian CO2 Seasonal South Polar Cap, Planet. Space Sci. 58, 1129-1138 (2010)
- P. O. Hayne, D. A. Paige and N. G. Heavens, The role of snowfall in forming the seasonal ice caps of Mars, Icarus 231, 122-130 (2014)
- H. H. Kieffer, P. R. Christensen and T. N. Titus, CO2 jets formed by sublimation beneath translucent slab ice in Mars' seasonal south polar ice cap, Nature 442, 793-796 (2006)
- D. M. Kass, A. Kleinböhl, D. J. McCleese, J. T. Schofield and M. D. Smith, Interannual similarity in the Martian atmosphere during the dust storm season, Geophys. Res. Lett. 43, 6111-6118 (2016)
- A. Sánchez-Lavega, T. del Río-Gaztelurrutia, A. Spiga, J. Hernández-Bernal, E. Larsen, D. Tirsch, A. Cardesin-Moinelo and P. Machado, Dynamical Phenomena in the Martian Atmosphere Through Mars Express Imaging, Space Sci. Rev. 220, 16 (2024)
- A. Sánchez-Lavega, T. del Río-Gaztelurrutia, J. Hernández-Bernal and M. Delcroix, The onset and growth of the 2018 Martian Global Dust Storm, Geophys. Res. Lett. 46 (2019)
- J. Beish for the Association of Lunar and Planetary Observers, Observing Mars part 6
- S. D. Guzewich et al., Mars Science Laboratory Observations of the 2018/Mars Year 34 Global Dust Storm, Geophys. Res. Lett. 46, 71-79 (2019)
- P. M. Streeter, S. R. Lewis, M. R. Patel, J. A. Holmes and D. M. Kass, Surface Warming During the 2018/Mars Year 34 Global Dust Storm, Geophys. Res. Lett. 47, e2019GL083936 (2020)
- V. T. Bickel et al., Dust devil migration patterns reveal strong near-surface winds across Mars, Science Advances 11, eadw5170 (8 Oct 2025)
- T. Pierron and F. Forget, No theoretical basis for an orbit-spin coupling inertial force in planetary atmospheres, Icarus 450, 116984 (2026)
- R. W. Stevens, P. O. Hayne, A. Kleinböhl and D. M. Kass, Atmospheric CO2 Ice in the Martian Polar Regions, arXiv 2509.02897 (2025)
- C. E. Newman, M. A. Mischna, J. H. Shirley et al., An initial assessment of the impact of postulated orbit-spin coupling on Mars dust storm variability in fully interactive dust simulations, Icarus 317, 649-668 (2019)
- J. H. Shirley, R. J. McKim, J. M. Battalio and D. M. Kass, Orbit-Spin Coupling and the Triggering of the Martian Planet-Encircling Dust Storm of 2018, J. Geophys. Res. Planets 125, e2019JE006077 (2020)
- J. Laskar, A. C. M. Correia, M. Gastineau, F. Joutel, B. Levrard and P. Robutel, Long term evolution and chaotic diffusion of the insolation quantities of Mars, Icarus 170, 343-364 (2004)
- NASA, The Fact and Fiction of Martian Dust Storms, 18 September 2015
- NASA JPL, Opportunity Hunkers Down During Dust Storm, 2018
- B. A. Cantor, MOC observations of the 2001 Mars planet-encircling dust storm, Icarus 186, 60-96 (2007)
- A. Brines et al., Out-of-season water escape during Mars' northern summer triggered by a strong localized dust storm, Commun. Earth Environ. 7, 55 (2 February 2026)
Checked on 24 August 2026. Where the science is unsettled this page says so rather than picking a winner.